The second CLINSH measurement campaign took place in Lobith from the first of November until the 17th of December 2019. TNO installed their trailer along the river Rhine in the Netherlands close to the German border (see Figure 1.) With mostly South and Southwesterly winds during the campaign, this was the ideal measurement location.
Estimating the ships emissions
The aim of this campaign is to estimate the ships emissions. This can be achieved by using the measurements in combination with a model (e.g. plume model), but it’s also possible to estimate emission by using the CO2 concentration as a tracer. The following components were measured; carbon dioxide (CO2), nitrogen oxide (NOx), ozone (O3), particulate matter (PM), Ultra fine particles (UFP), black carbon (BC) , meteorological conditions and the Automatic Identification System (AIS) signal of the ships.
Main components measured
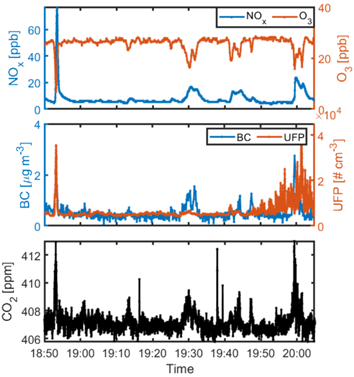
Figures 2 gives an overview of the main components measured and shows some typical patterns. The figure indicates that NOx, BC and CO2 are emitted by ships. For O3 we see the opposite behavior and actually a dip when a ship plume passes by. This is due to the fact that the emitted NO of the ships reacts together with O3 to form O2 and NO2. For UFP the amount of particles where measured. It is clear that some ships do show an emission of UFP, while for others not a clear increase in the amount of particles is visible. In the coming months steps will be undertaken to estimate emissions from the measurements.